 Scarlette FerrariHuman StoriesScarlette FerrariHuman Stories
 Frank WhitakerStories, Markets & Discovery
 Douglas SterlingMarkets, People & Humor
 Barbara Abigail HemingwayPeople & Everyday Life
 Walter L. RosenbergPeople, Memory & Why
 Stanley “Stan” RosenbergSolutions, Travel & Discovery
Ford Morning Options Report
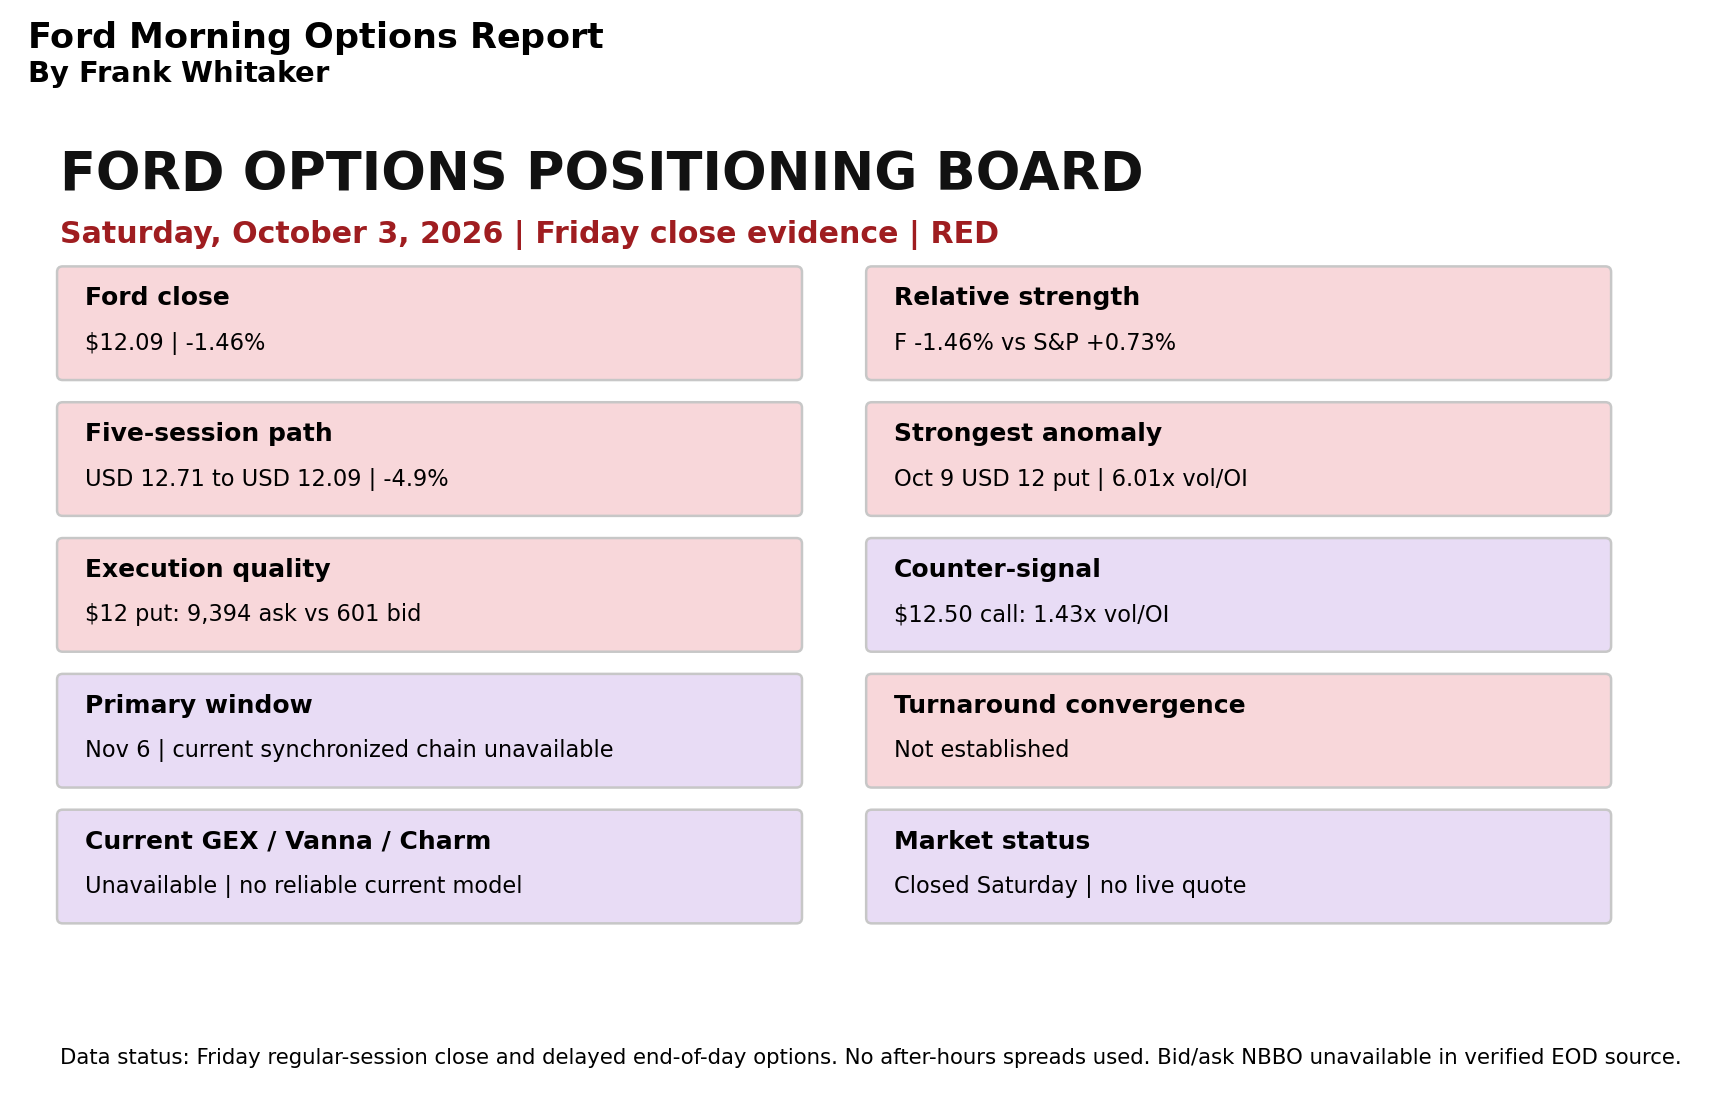
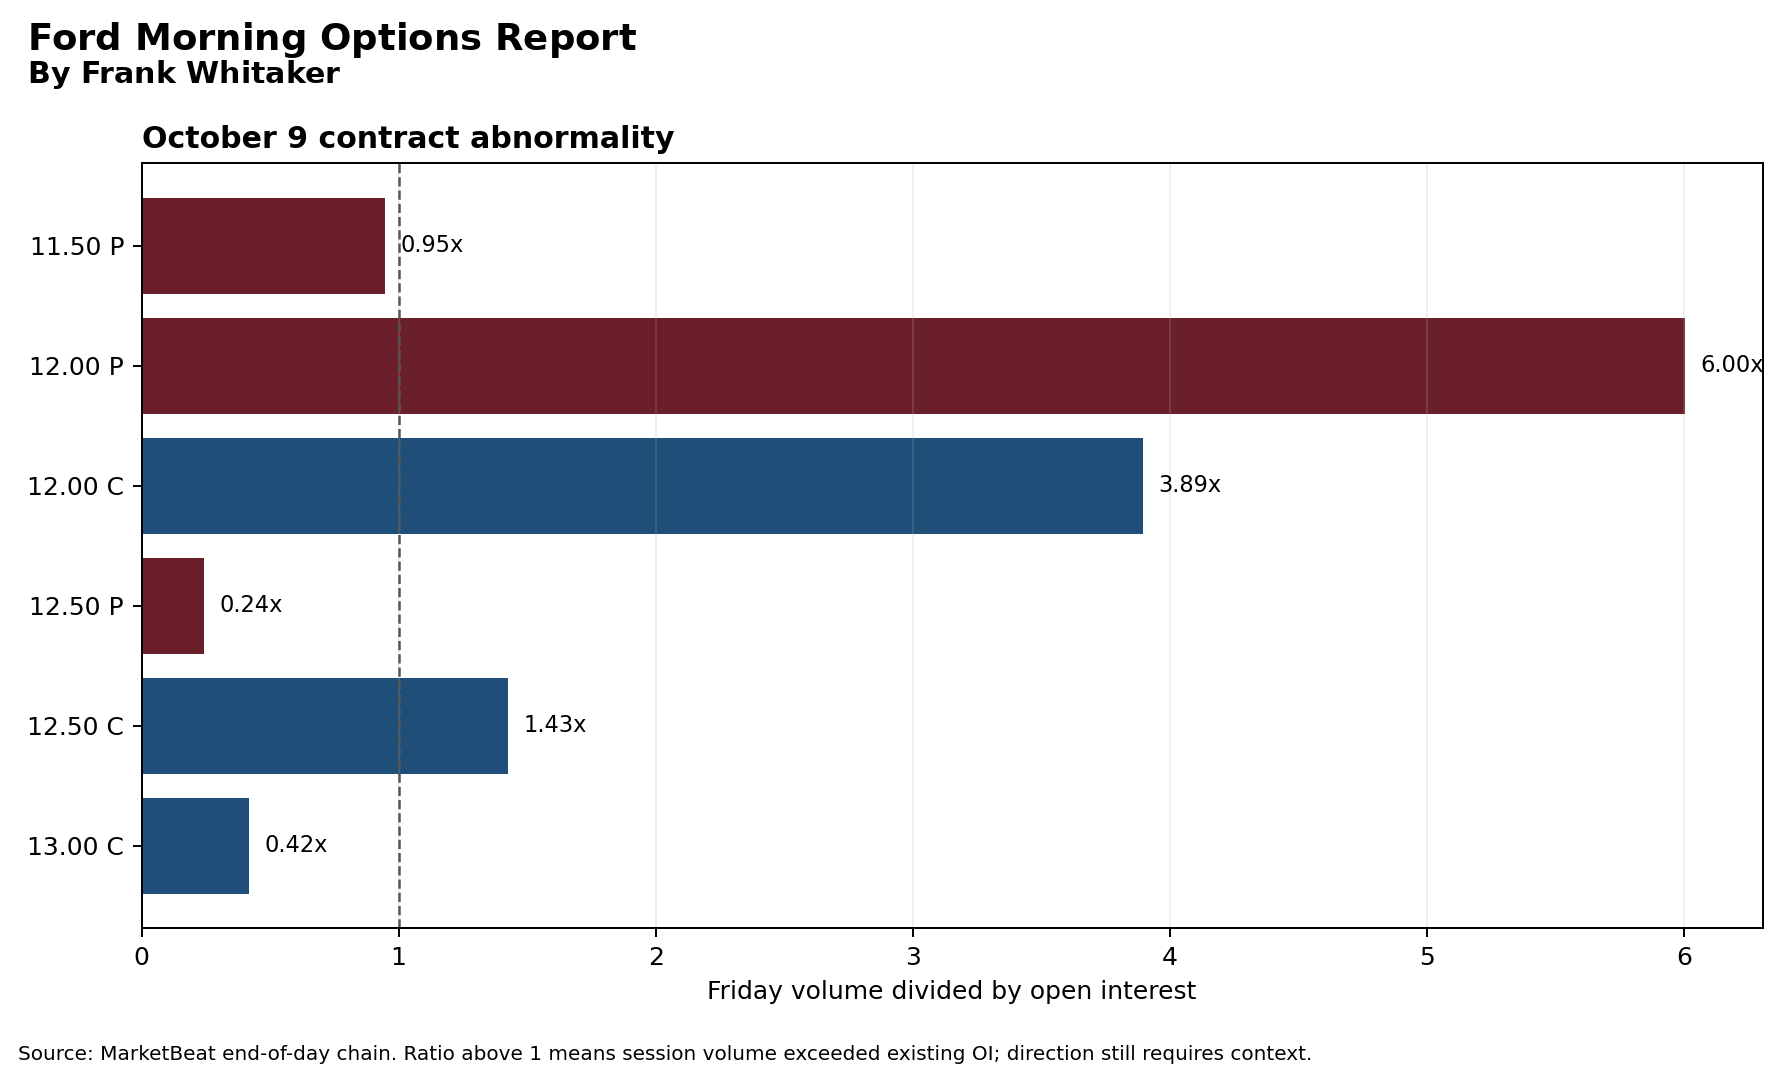
The color belongs to the evidence in this report, not to a Buy, Sell, or Hold recommendation. Ford finished Friday near $12.09, down about 1.46%, while the S&P 500 gained 0.73%. That relative-performance gap matters because the wider market received help from a weak employment report, yet Ford moved the other way after its quarterly sales release. The options market agreed most strongly at the $12 strike: the October 9 $12 put traded 10,839 contracts against 1,805 open contracts, roughly six times open interest, with 9,394 contracts classified near the ask and only 601 near the bid. That is the clearest new warning in the chain. It still does not prove those puts were outright bearish purchases, but price, abnormality and execution location all point in the same cautious direction.
- Operating evidence has improved.
- Price confirmation remains essential.
- Verify timestamps before acting.
Research disclosure: Human editorial judgment with AI-assisted research. Verify independently.
RED — Friday resolved the week toward caution
The color belongs to the evidence in this report, not to a Buy, Sell, or Hold recommendation. Ford finished Friday near $12.09, down about 1.46%, while the S&P 500 gained 0.73%. That relative-performance gap matters because the wider market received help from a weak employment report, yet Ford moved the other way after its quarterly sales release. The options market agreed most strongly at the $12 strike: the October 9 $12 put traded 10,839 contracts against 1,805 open contracts, roughly six times open interest, with 9,394 contracts classified near the ask and only 601 near the bid. That is the clearest new warning in the chain. It still does not prove those puts were outright bearish purchases, but price, abnormality and execution location all point in the same cautious direction.
Why today
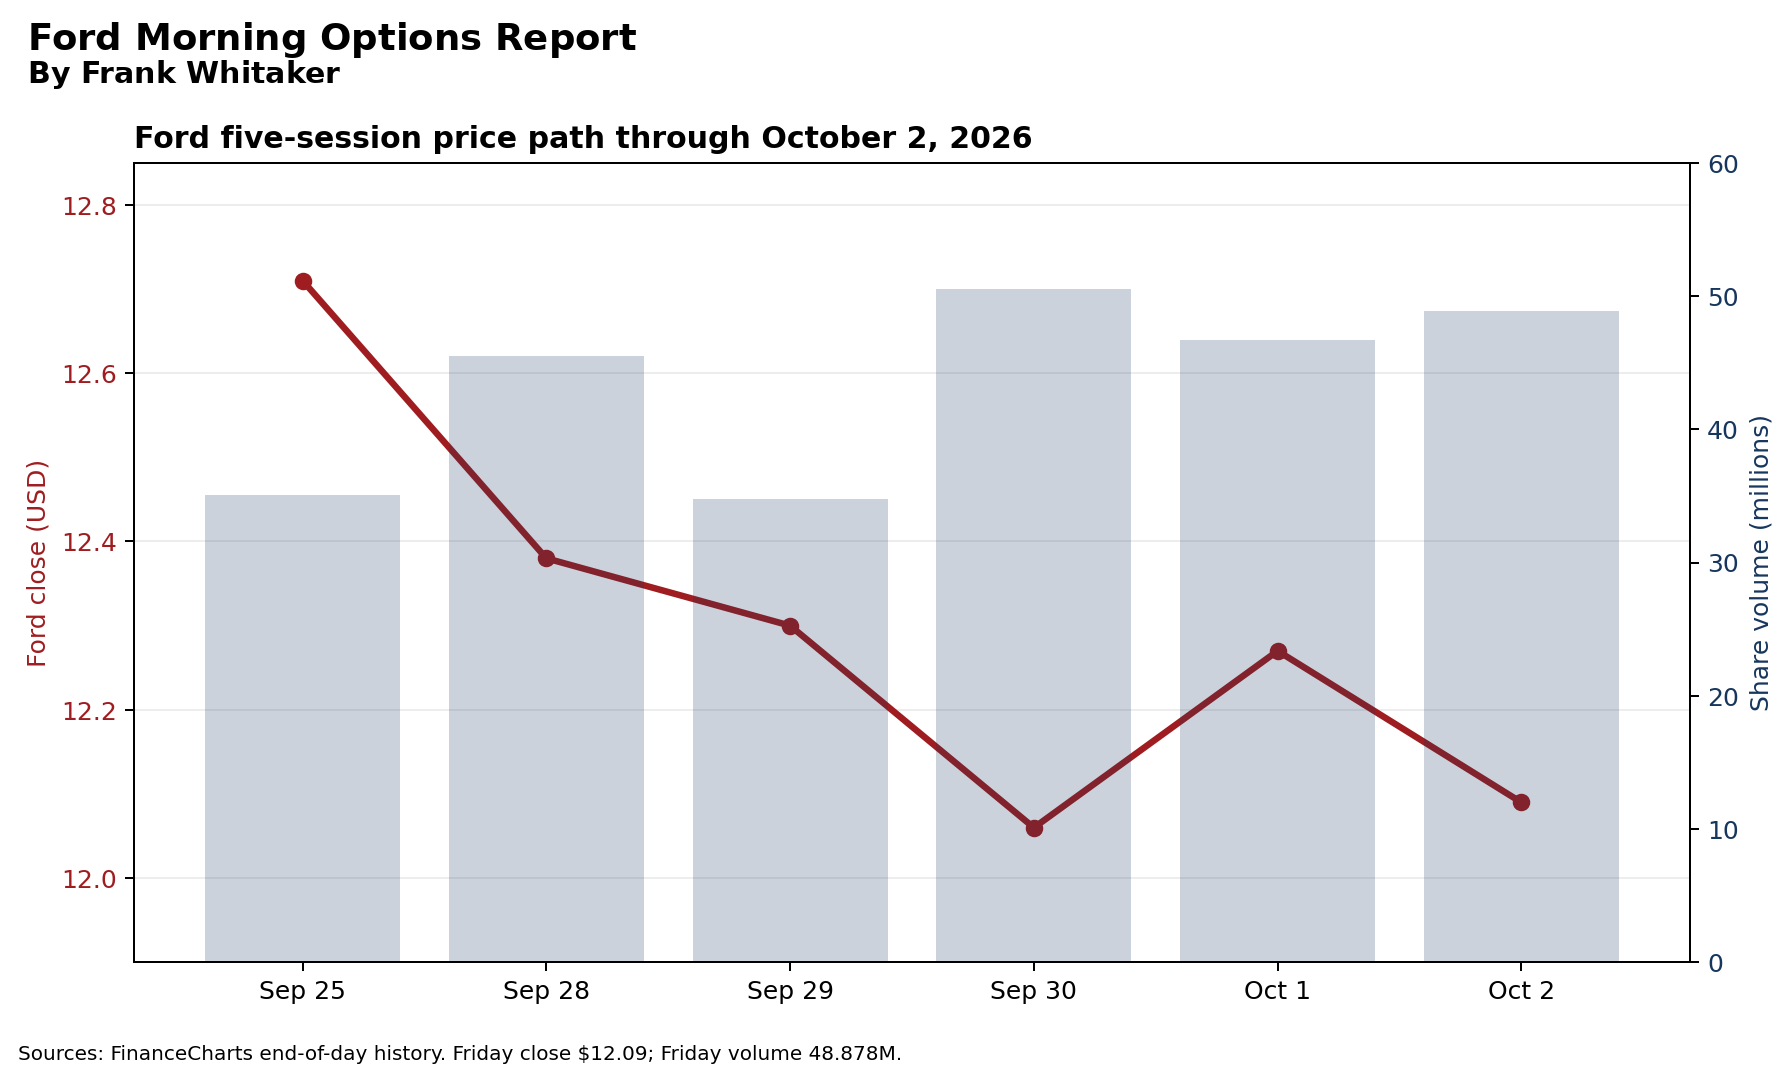
Friday was the week’s resolution day. Ford began the five-session comparison near $12.71 on September 25 and ended at $12.09, a decline of about 4.9%. Thursday’s rebound to $12.27 did not survive Friday’s company news. Share volume rose to 48.878 million, close to recent normal activity, so the move was neither a low-volume curiosity nor a dramatic capitulation. The important change was not simply that Ford fell. It fell while the broad market rose, and the most abnormal next-week contract was a put sitting almost exactly at the stock price.
What changed from Thursday
Thursday had supplied a constructive clue: Ford recovered 1.74% and completed-session options volume leaned toward calls. Friday overturned that clue. The stock gave back most of the rebound, and the October 9 $12 put carried more than twice the volume of the $12 call. The $12 call was also active—4,222 contracts against 1,084 open interest—and its Delta near 0.59 showed meaningful responsiveness. But its open-interest increase was only 121 contracts, compared with 563 for the $12 put. Weighing magnitude rather than counting signals puts the $12 put first.
Five-day positioning evolution
Earlier in the week, attention gathered in expiring October 2 calls at $12.50 and $13. Those contracts accumulated open interest, but Ford never confirmed the optimistic interpretation and their premiums collapsed into expiration. Friday’s chain shifted the active decision area down to $12 and moved the usable horizon out one week to October 9. That is strike and expiration movement, but it is not bullish turnaround migration. The evidence moved closer to the stock and remained short-dated.
Horizon map and missing comparison
The October 16 near-term expiration, November 6 primary turnaround window, November 20 medium-term window and December 18 longer-term window remain part of the permanent framework. A synchronized Friday chain for those expirations was not exposed by the verified source used here. Therefore this report preserves the last verified positioning map—large two-sided October 16 interest around $12 to $14, comparatively thin November 6 positioning near the stock, and larger November 20 concentrations—without pretending those figures were refreshed Friday. Current strike migration beyond October 9 is unconfirmed.
Volatility and Greeks in context
The October 9 $12 put closed near $0.164 with implied volatility around 27.1% and Delta around -0.42. The source did not provide a synchronized bid and ask, Gamma, Theta or Vega. For education only, a simple Black-Scholes calculation using Friday’s close, seven calendar days and the reported IV produces approximate Gamma, Theta and Vega values in the detailed table. Those are model estimates, not exchange quotes. The practical lesson is more important than false precision: near expiration, Gamma can rapidly change Delta near $12, while Theta removes time value each day. A quick Ford move can overpower Theta; a quiet rebound cannot.
Event and company context
Ford reported third-quarter U.S. sales of 509,764 vehicles, down 6.6%. That headline was negative, but the canyon has another side. Ford said the planned phase-out of Escape and Corsair explained much of the decline; excluding those models, it estimated retail share increased about 0.4 percentage points to 12.1%. September F-Series sales rose 2.4%, Super Duty production reached a 19-year quarterly high, and the company said the short F-150 interruption could be contained within its full-year adjusted EBIT guidance. Those operational positives did not prevent the shares from underperforming Friday.
Turnaround Watch and Convergence
Turnaround convergence is not established. The first requirement is simple: Ford must hold the $12 neighborhood and stop producing lower weekly lows. A stronger test would be a reclaim of $12.50 accompanied by share volume and relative outperformance. Options confirmation would require new open interest to persist in later expirations, especially the 31–45 DTE window, rather than living primarily in one-week contracts. The color could improve from red to purple if price stabilizes, the $12 put anomaly fails to persist, and call positioning migrates outward. It would deteriorate if Ford loses $12 while put open interest expands below the market.
False-signal warnings
Ask-side classification is an indicator, not proof of a buyer’s intent. The $12 put activity may include spreads, hedges, closing trades or put writing paired with stock. Open interest settles after trading and cannot identify the initiating side. Friday also contained a company sales catalyst, which can create temporary protection. Bid and ask quotes were unavailable in the verified end-of-day table, so spread quality cannot be calculated. Current GEX, gamma-flip, Vanna and Charm estimates were also unavailable from a reliable synchronized feed and are omitted rather than invented.
Options Lesson
Volume tells us what traded; open interest tells us what remained open before the session; the next open-interest update helps show what survived. Friday’s $12 put volume was six times existing OI, but only the following settlement can reveal how much became new outstanding positioning. A large volume/OI ratio deserves attention. It does not, by itself, reveal direction or strategy.
Options basics
BUY = right. SELL = obligation. A bought call gives the right, but not the obligation, to buy shares at the strike. A sold call creates an obligation, if assigned, to sell or deliver shares depending on the strategy. A bought put gives the right, but not the obligation, to sell shares. A sold put creates an obligation, if assigned, to purchase shares. One standard U.S. equity-option contract generally represents 100 shares unless adjusted. Selling 10 standard Ford $12 puts can create an obligation to purchase 1,000 shares for $12,000. Selling 10 standard $12.50 calls creates an obligation involving 1,000 shares. Premium received does not erase that exposure.
Bottom line
RED. Ford ended the week weaker than its own Thursday rebound, weaker than the S&P 500, and directly above an unusually active $12 put. The $12.50 call remains a counter-signal worth watching, but the evidence with the greatest magnitude and the best price confirmation points toward caution. The potential positioning zone is $12 to $12.50. It is not a floor. Monday’s first questions are whether $12 holds, whether Friday’s put volume becomes lasting open interest, and whether any positioning moves into the primary 31–45 DTE turnaround window.
Producer-disclosed unavailable information
- Approved OPTIONS producer/writer/template/route Registry references
- Authoritative submission endpoint and credential binding
- Current synchronized Nov 6/Nov 20/Dec 18 chain
- Current GEX/Vanna/Charm
- Friday NBBO bid/ask and sweep/block/open-close classifications
Additional supplied DOCX content
By Frank Whitaker
Saturday October 3 2026 | Friday close evidence | Research and education
RED The week resolved toward caution; turnaround convergence is not established.
Five session evidence map
Friday October 9 contract board
Bid/ask and spread percentage: unavailable in the verified end-of-day source. Ask/bid volume classification is shown below; it is not definitive buyer/seller identification.
Dated Ford calendar
Sourced evidence map
MarketBeat Ford options chain: https://www.marketbeat.com/stocks/NYSE/F/options/
FinanceCharts Ford volume history: https://www.financecharts.com/stocks/F/summary/volume
Ford Q3 sales release: https://www.fromtheroad.ford.com/us/en/articles/2026/ford-2026-third-quarter-sales-results
Reuters Ford Q3 sales: https://www.reuters.com/business/autos-transportation/fords-quarterly-us-sales-dip-after-phasing-out-some-models-2026-10-02/
Associated Press market close: https://apnews.com/article/48e9066481cba91a5d7c6688aa74a5cd
Ford Investor Relations: https://www.shareholder.ford.com/Home/default.aspx
Analyst context
The latest verified broad analyst context remains mixed. A July FactSet sample reported roughly 30% Buy and 61% Hold ratings. Citi upgraded Ford to Buy after second-quarter results, while other analysts emphasized execution risk around Ford’s EV platform and investment program. This is context, not this report’s recommendation.
Data gaps and status
| expiration | strike | type | dte | last | vol | oi | oi_change | ask_vol | bid_vol | iv | iv_change | delta | vol_oi | gamma_est | theta_est | vega_est |
| Oct 9 | 11.5 | Put | 7 | 0.049 | 1290 | 1363 | 16 | 812 | 296 | 36.54 | -2.53 | -0.1518 | 0.94644167278063 | 0.38975521200441 | -0.010419785029739 | 0.0039922548006661 |
| Oct 9 | 12 | Put | 7 | 0.164 | 10839 | 1805 | 563 | 9394 | 601 | 27.14 | -2.93 | -0.4162 | 6.0049861495845 | 0.85670212028266 | -0.01263511706403 | 0.0065177464589691 |
| Oct 9 | 12 | Call | 7 | 0.269 | 4222 | 1084 | 121 | 1556 | 1168 | 31.81 | 1.79 | 0.5872 | 3.8948339483395 | 0.73480201291032 | -0.014887693430251 | 0.0065522699787334 |
| Oct 9 | 12.5 | Put | 7 | 0.476 | 650 | 2661 | 66 | 101 | 127 | 32.63 | 4.86 | -0.7588 | 0.24426907177753 | 0.56464630921736 | -0.012037613164607 | 0.0051647742661506 |
| Oct 9 | 12.5 | Call | 7 | 0.078 | 4409 | 3090 | 774 | 2266 | 1716 | 32.63 | 4.84 | 0.2483 | 1.4268608414239 | 0.56464630921736 | -0.012037613164607 | 0.0051647742661506 |
| Oct 9 | 13 | Call | 7 | 0.025 | 1319 | 3157 | 308 | 550 | 646 | 37.32 | 3.34 | 0.0898 | 0.41780171048464 | 0.24659270479307 | -0.0068769083431938 | 0.0025797619722592 |
| Session | Price | Share volume (millions) |
| Sep 25 | 12.71 | 35.094 |
| Sep 28 | 12.38 | 45.502 |
| Sep 29 | 12.3 | 34.786 |
| Sep 30 | 12.06 | 50.536 |
| Oct 1 | 12.27 | 46.687 |
| Oct 2 | 12.09 | 48.878 |
| Subject | Original metadata |
| underlying | {"price": 12.09, "as_of": "2026-10-02T15:59:00-04:00", "status": "regular-session close"} |
| options | {"as_of": "2026-10-02 EOD", "oi_effective_date": "2026-10-02 EOD source display", "status": "delayed end-of-day"} |
| sp500 | {"change_pct": 0.73, "as_of": "2026-10-02 close"} |
| Session | Close | Share volume M | Reading |
| Sep 25 | $12.71 | 35.094 | Comparison start |
| Sep 28 | $12.38 | 45.502 | Lower close |
| Sep 29 | $12.30 | 34.786 | Call OI grew; price did not confirm |
| Sep 30 | $12.06 | 50.536 | Put-heavy session |
| Oct 1 | $12.27 | 46.687 | Rebound |
| Oct 2 | $12.09 | 48.878 | Rebound failed; market underperformance |
| Exp | Strike | Type | DTE | Last | Vol | OI | V/OI | OI chg | IV | Delta |
| Oct 9 | $11.50 | Put | 7 | $0.049 | 1,290 | 1,363 | 0.95 | +16 | 36.54% | -0.152 |
| Oct 9 | $12.00 | Put | 7 | $0.164 | 10,839 | 1,805 | 6.00 | +563 | 27.14% | -0.416 |
| Oct 9 | $12.00 | Call | 7 | $0.269 | 4,222 | 1,084 | 3.89 | +121 | 31.81% | 0.587 |
| Oct 9 | $12.50 | Put | 7 | $0.476 | 650 | 2,661 | 0.24 | +66 | 32.63% | -0.759 |
| Oct 9 | $12.50 | Call | 7 | $0.078 | 4,409 | 3,090 | 1.43 | +774 | 32.63% | 0.248 |
| Oct 9 | $13.00 | Call | 7 | $0.025 | 1,319 | 3,157 | 0.42 | +308 | 37.32% | 0.090 |
| Contract | Ask vol | Bid vol | Ask/Bid reading | Gamma est | Theta est/day | Vega est/IV pt |
| $11.50 Put | 812 | 296 | Ask-heavy | 0.390 | -0.0104 | 0.0040 |
| $12.00 Put | 9,394 | 601 | Ask-heavy | 0.857 | -0.0126 | 0.0065 |
| $12.00 Call | 1,556 | 1,168 | Ask-heavy | 0.735 | -0.0149 | 0.0066 |
| $12.50 Put | 101 | 127 | Mixed | 0.565 | -0.0120 | 0.0052 |
| $12.50 Call | 2,266 | 1,716 | Ask-heavy | 0.565 | -0.0120 | 0.0052 |
| $13.00 Call | 550 | 646 | Mixed | 0.247 | -0.0069 | 0.0026 |
| Date | Event | Status | Options relevance |
| Oct 2, 2026 | Q3 U.S. sales released | Completed | Sales catalyst now reflected in Friday trading |
| Oct 9, 2026 | Weekly option expiration | Verified listed expiration | $12 strike is immediate decision area |
| Oct 14, 2026 | U.S. inflation data | Reported market calendar | Rates and Ford Credit affordability risk |
| Oct 28, 2026 | Ford Q3 earnings | Official Ford calendar | Event volatility; confirm date before trading |
| Source | Effective date | Status | Used for |
| MarketBeat Ford options chain | Oct 2, 2026 EOD | Delayed end-of-day | Oct. 9 volume, OI, OI change, execution classification, IV, Delta |
| FinanceCharts Ford volume history | Oct 2, 2026 close | End-of-day | Five-session price and share-volume history |
| Ford Q3 sales release | Oct 2, 2026 | Company source | Sales, production and product-mix context |
| Reuters Ford Q3 sales | Oct 2, 2026 | News report | Independent sales and affordability context |
| Associated Press market close | Oct 2, 2026 | Market close | S&P 500 and broad-market comparison |
| Ford Investor Relations | Observed Oct 3, 2026 | Official calendar | Oct. 28 Q3 earnings event |
| Item | Status |
| Saturday live market | Closed; no live quote or option spread used |
| Friday NBBO bid/ask | Unavailable in verified EOD table |
| Sweep/block/multi-leg/open-close | Unavailable |
| Current Nov 6 synchronized chain | Unavailable |
| IV surface and term structure | Incomplete |
| Current GEX/gamma flip/Vanna/Charm | Unavailable; no reliable synchronized model |
| Website mapping/receipt | Unresolved; no submission attempted |
MarketBeat Ford options chain Oct 2, 2026 EOD Delayed end-of-day Oct. 9 volume, OI, OI change, execution classification, IV, Delta
FinanceCharts Ford volume history Oct 2, 2026 close End-of-day Five-session price and share-volume history
Ford Q3 sales release Oct 2, 2026 Company source Sales, production and product-mix context
Reuters Ford Q3 sales Oct 2, 2026 News report Independent sales and affordability context
Associated Press market close Oct 2, 2026 Market close S&P 500 and broad-market comparison
Ford Investor Relations Observed Oct 3, 2026 Official calendar Oct. 28 Q3 earnings event
Download DOCX — Ford Morning Options Report — By Frank Whitaker
Download Indicator Board PNG — Ford Morning Options Report — By Frank Whitaker
Download Five-session chart PNG — Ford Morning Options Report — By Frank Whitaker
Download October 9 options chart PNG — Ford Morning Options Report — By Frank Whitaker